Saturday, October 18, 2014

MORE MODELS SOLIDIFY CONTENT KNOWLEDGE

PERIODIC TREND MODLES BUILD ON CONTENT KNOWLEDGE


"Mr. Miller, did you realize that the periodic table is arranged in more ways than just atomic number?"

"There is a definite pattern that for the elements!!!"

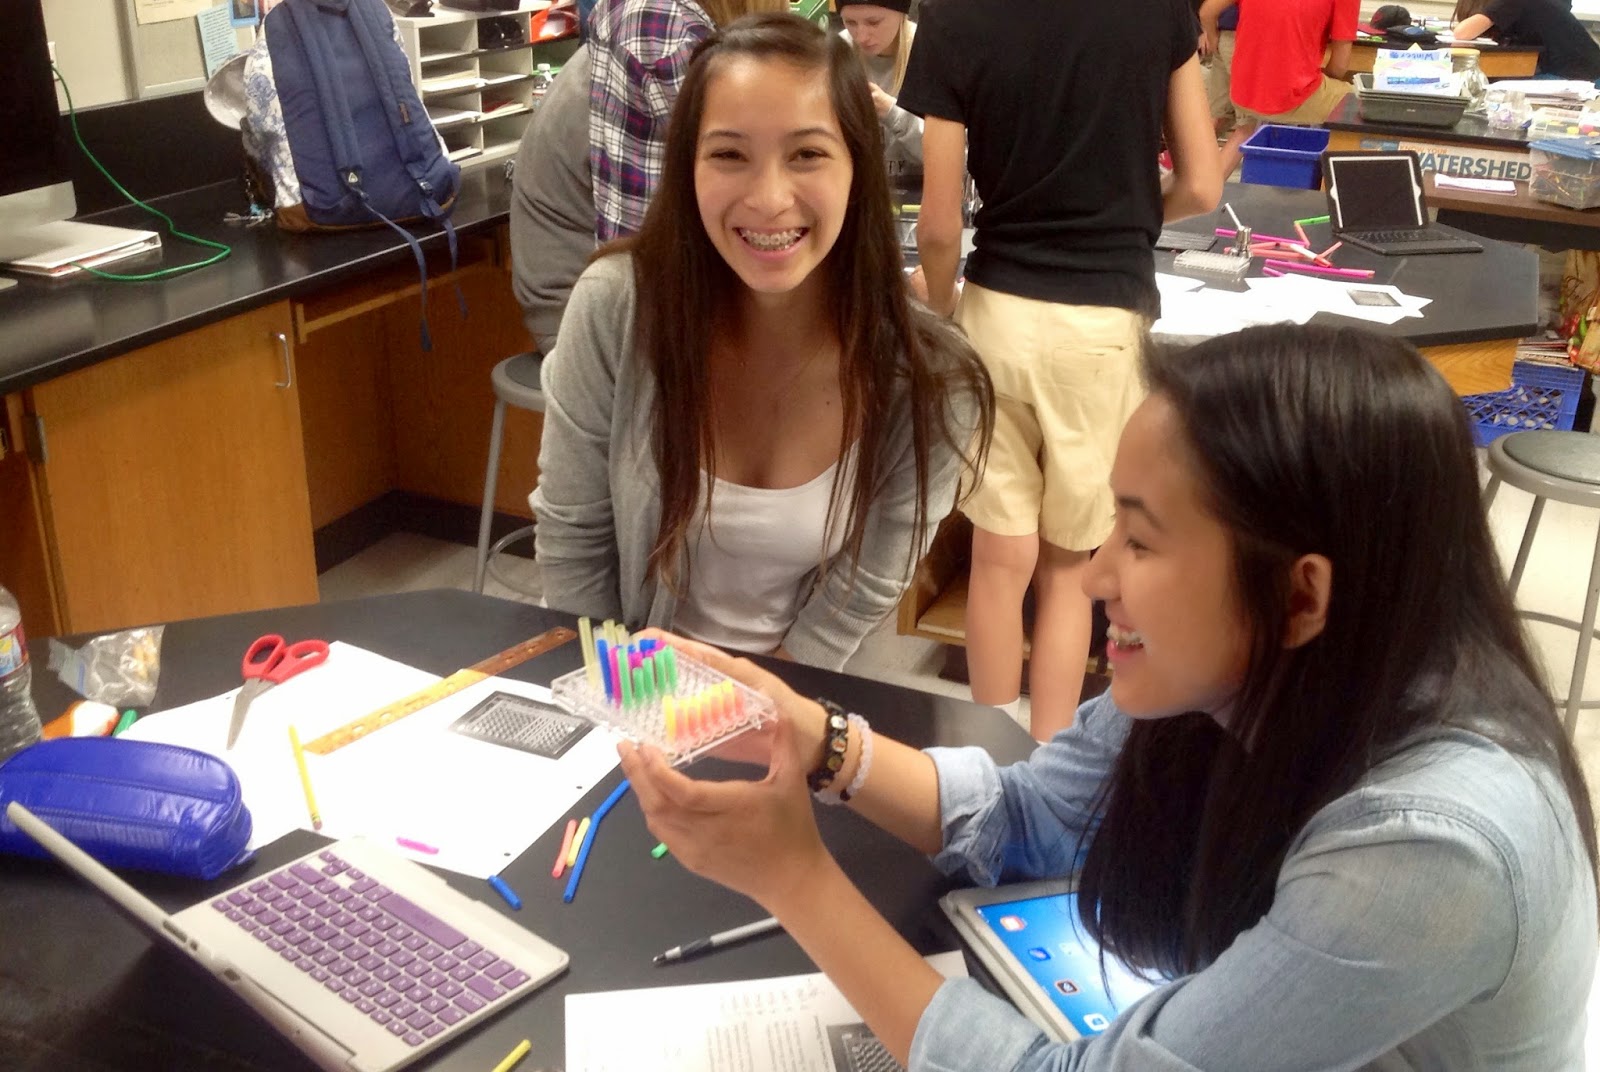
These are just two of the many statements that students shared with me as they built models based upon electronegativity and ionization energy in class this week.


The Periodic Trends Lab (Electronegativity in 3D) is very basic and utilizes drinking straws (color straws @ Smart & Final) and a 96 well tray. Students cut straw lengths to match the values of electronegativity values.  As students build the model they can see they very distinct pattern of the periodic arrangement of the elements based upon electronegativity.  


Students followed up the Electronegativity trend model by creating a similar model for Ionization Energy using a scale of 1 cm = 300 kJ.  


MODELS - APPLY AND SYNTHESIZE FLIPPED CONTENT

STUDENTS BUILD MODELS TO APPLY AND SYNTHESIZE FLIPPED CONTENT

Models can be a highly effective means of providing pathways for students to synthesize and apply the content they are provided. 

In the Flipped Classroom I have adopted for my chemistry courses it has become an essential aspect of the curriculum, to use student developed models to transition from the media content they view at home to the application of the material in the classroom. 

Models can range from simple to complex but I have found that it is the simplicity of a model that students can truly develop their own understanding and insights in a way that allows them to share with their peers and take ownership of their knowledge. 

We recently used a Bohr Model template and clay to introduce the structure of the atom, the arrangement of subatomic particles and the intricacies of isotopes, and ions. 

Students built models, took pictures on their iPads and annotated them using a an app called Skitch and then created iMovies about the isotopes of the first 20 elements. Although the Bohr Model has several flaws and is not a true arrangement of the electrons of an atom, building these models laid a solid foundation for students as they continued into the cloud model, electron and orbital configuration and eventually to Lewis Dot structures and the VSEPR models. 


Prior to Flipping my classroom I would not have had time to have students do this in class and be able to have the more in depth discussions I engaged in with my students concerning the importance of electron arrangement, density of the nucleus, the neutron as the the defining value of the atom and the shielding effect created by the neutrons, all generated from student questions and discussions I overheard as I was fulfilling my role as "Guide on the Side" rather than "Sage on the Stage".


Tuesday, October 14, 2014

"Flipping" - We Teach2Learn

You can't give something away unless first you own it yourself. 

Even knowledge must be first owned before it can be shared. 

One of the major themes in my "flipped" classroom stems from the work of Dr. Gary Philips and his work in Brain Research as part of the National School Improvement Project.

We remember 92% of What we Teach Each Other.


One of the means we use in my classroom to synthesize material from the flipped lessons they complete on Sophia.org is to engage students in a process that allows them to teach each other. 

Students work through prompts on lab tabletops with fluorescent dry erase markers to teach, re-teach and learn the material.  Students help each other to understand material by solidifying their own knowledge base through a model of TEACH2LEARN. 


I take the role of Guide on the Side, providing prompts, to guide students who have drifted off track or who may be misguiding in their explanations. My role is to observe and evaluate student understanding as they teach each other. 


Monday, October 6, 2014

Pecha Kucha - Chit Chat for Learning

Pecha Kucha - Chit Chat for Learning
  1. Pecha Kucha
  2. PechaKucha or Pecha Kucha (Japanese: ペチャクチャ, IPA: [petɕa ku͍̥tɕa], chit-chat) is a presentation style in which 20 slides are shown for 20 seconds each (6 minutes and 40 seconds in total). The format, which keeps presentations concise and fast-paced, powers multiple-speaker events called PechaKucha Nights (PKNs).

As a means of presenting information the Pecha Kucha (chit chat) format provides an opportunity for students to combine images and words to present their ideas in a new way incorporating technology. 

The Pecha Kucha format is based upon a 20 x 20 design of 20 images for 20 seconds. Students narrate their Pecha Kucha following the format made popular by PechaKucha Nights (PKN) all over the world. 

This format provides an opportunity to authentically present an idea in a way that encourages them to incorporate imagery to coincide with their own words. Twenty seconds can pass in the blink of an eye or can seem like an eternity. Students need to evaluate what they want to say and how they want to say it in a meaningful manner while incorporating the meaning of an  image.  Five seconds of silence stands out like a sore thumb while rushing to fit an words into a 2-0 second window can diminish the effective ness of the message.  The 20 x 20 format comes out to a total of 6 minutes and 40 seconds which when planned and executed properly can brilliantly share the students passion for a particular topic, theme or idea. 

Pecha Kucha Formats
Mindfulness in Education
TLT Pecha Kucha in the Classroom
Pecha Kucha Tips, Resources and Examples - Catherine Cronin 
A Pecha Kucha about Pecha Kucha

My Environmental Science students created their own Pecha Kucha presentations to share information about Trash and Recycling. 

Limiting Trash by Recycling
Ocean Trash
Dangers of Plastics
Damaging Oceans and Beaches

Oh  and by the way,  we used each of the 6 C's in the process as well, Critical Thinking - development of a themeCommunication - digital and verbalCollaboration - working in a groupCulture - effects on societyCreativity - blending images and wordsConnectivity - uploading to YouTube


Thursday, October 2, 2014

FLIPPING IS MORE THAN JUST WATCHING VIDEOS AT HOME

What is Flipping and Why?

I have flipped parts of many of my classes for several years now.  I have flipped parts of Anatomy, Biology and Chemistry courses.  This year I have committed to FLIPPING my entire Honors Chemistry Course.  I use SOPHIA.org to create tutorials and playlists of my videos (SMARTERTEACHER Sophia) which are available also available on You Tube. I use Screencast-o-matic to create my own video lessons, and supplement my own videos with videos from Tyler Dewitt, Paul Anderson (Bozeman Science), Brian Swarthout and Steve Spangler and Crash Course. I have now completed the first five weeks of the course and four chapters of the text. My students have engaged in labs, hands on activities and projects in every block this year (See Page).   

I have put together a brief video to explain this to the parents of my students. 


    The Best Aspects of Flipping My Class

  • Student Focused Classroom
  • Authentic Application
  • Improved use of Technology
  • Student Ownership of Their Learning
  • Use of Formative Assessment
  • TIME, TIME, TIME!!!!!
Student Focused Classroom
My classroom has become more them and less of me.  I spend more time engaged in authentic discussions with the students addressing their questions and understanding. I have spent very little time in lecture, directing the class and in disciplining students.

Authentic Application
My students have had ten class meetings and have done a lab, hands on activity or engaged in project based learning. (See Page)

Improved Use of Technology
We became a one to one iPad school this year and have converted from Moodle to BlackBoard for our LMS. I have increased the the interaction for my students and technology.
  •  Students access the BlackBoard LMS on their iPads
  •  Students download pdfs of lecture notes and worksheets and upload them to Notability to take notes or complete work.
  •  Periodic Table is a html interface for students to access on the iPad
  •  Students have downloaded and followed lab instructions on their iPads
  •  Students have used the iPad to document lab data and observations.
  •  Students use the iPad calculator to complete problem solving
  •  Students have created photo collages and iMovies of class activities and labs
  •  Students have used the Skitch app to annotate photos of lab observations
  •  Students have followed lessons on NearPod app
  •  Students have accessed SOPHIA Playlists and Tutorials on their iPads
  •  Students have used the iPads to search information and research
  •  Students have viewed TEDs and completed TEDitorial assignments on iPads
  •  Students have created Infographics using their iPads
  •  Students have submitted discussion points to a Padlet Graffiti Wall on the SMART Board. 
Student Ownership of Their Learning
Students learn on their time at their pace. Students are able to access Sophia playlists whenever the can wherever they are.  

Increased Use of Formative Assessment
I am more aware of student understanding and application of material by having the time to authentically engage with students beyond simply sharing content. I am therefore, able to evaluate the learning process in my classroom for both my students and as an educator. 

TIME! TIME! TIME!
Time in class to engage in the types of activities that engage students in the development of their skills for learning. 


Tuesday, September 23, 2014

How Far Does Your Impact Reach?

Yesterday, I celebrated Fifty-Three years on the earth. It doesn't seem as bad when you write it out in words rather than digits. As birthdays go I really don't worry about them anymore or think about celebrating them too much.  I'm feel a little to old for cake and ice cream and not quite old enough to celebrate how long I've survived. But, yesterday I was blown away. And reminded why I teach.

A former student who kicked and screamed and cried and pleaded and pouted her way through high school, asking the very questions we as educators dread, "When, am I going to use this in real life?", "Why do I have to take subjects I hate?", "Why is "SCIENCE" so hard?" I am sure you have heard them all as well.

She showed up with the most beautiful representation of appreciation I could have ever imagined.  A cake in my favorite candy bar flavor, "Milky Way, Simply Caramel".  Emblazoned with the Periodic Table I created for the Chemistry classes here at La Salle High School.

She explained that she had spent the weekend, testing and re-testing four different cakes until she got the flavor and consistency just right for the final product.  She had another student who I tutor sampling to make sure the cake was just right. This sounds like the "SCIENTIFIC METHOD" at work. So much for,"When I going to use this in real life?" I would say there might have been a little bit of CHEMISTRY involved as well.

She went on to explain how she went online to find a copy of the periodic table that I created for the chemistry class she took. She then used food coloring to mix and match while dyeing the fondant to match the colors from the periodic table. Seems like a little bit of "SCIENCE" in action there.  Maybe even a little bit of PHYSICS, where I taught her about additive and subtractive colors. 


Now this Nursing (SCIENCE) student in her sophomore year in college explained how she recreated each element square of the periodic table with Symbol and Atomic Number, Group, Family and Period and painstakingly lined them up to complete an almost perfect replica of the Periodic Table. 


It was so beautiful, I didn't want to cut it. But, she insisted I need to taste it because she had to make sure that the Simply Caramel flavor was correct. 

Upon sharing this experience with my department colleagues, the overwhelming reaction was, "What an impact I must have had on this individual."  I always knew that as much as she complained about her high school experience, she did appreciate the opportunities for education she experienced in my classroom. But this was way beyond what I could have ever expected. 

So, Why do I TEACH?  

Because, I never know how far the experiences of my classroom will reach.

Oh  and by the way.  I think she used a few of the 6 C's in the process as well, Critical Thinking, Communication, Collaboration, Culture, Creativity, Connectivity

Yep!!! They were all in action.


Thursday, July 24, 2014

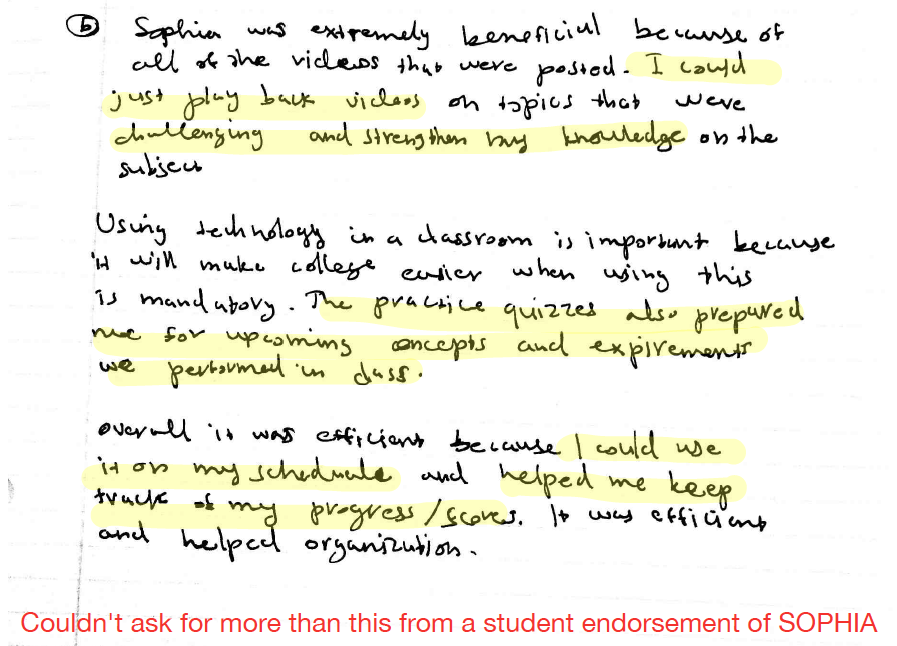
SOPHIA ENDORSED BY "FLIPPED" STUDENT

SOPHIA ENDORSED BY "FLIPPED" STUDENT

As part of my courses I always provide an opportunity for students to evaluate and review the course. 
One of the questions on my Summer Biology Hybrid Course, was "How was your process of learning affected by the use of the  SOPHIA website.


As a proponent of the "Flipped Classroom" and having used SOPHIA for several semesters now, I can't tell you how excited I was when I read this commentary from a student from my class. This answer basically looks like she read the manual for teaching in the flipped classroom as she hit most of the key points that "Flippers" claim as the benefits of the "Flipped Classroom".


Monday, July 21, 2014

SUMMER HEALTH INFOGRAPHICS

SUMMER HEALTH INFOGRAPHICS
8 Themes from the Documentary ESCAPE FIRE


In his Last Lecture, Randy Pausch tells of being floored when he saw the first projects created by the students of his Virtual Worlds Course at Carnegie Mellon.  He approached his mentor and asked, "What do I do? They surpassed all expectations."  His mentor suggested,  "Tell the students, that they did a fine job, but I think you can do better."

This is great advice and I am at that same point with my Summer Health students as they have simply floored me with the Infographics that they created in response to the issues shared in the documentary "Escape Fire".  In a previous blog, "The Value of Information - Infographics in the Classroom" I described the assignment and the process of preparing the students for this project.  Today students shared their Infographics with the class and I was just BLOWN AWAY.  While the Infographics are not perfect, and there could be some tweaks here and there, these son to be Sophomores amazed me with their research, data and the infographics each group created.  WOW!!!


Friday, July 18, 2014

WHY I KEEP TEACHING

Why I Keep Teaching


I am not an Edutainer, my job is not to entertain the students in order to get them to learn. 

My job is to make them think and learn the skills that will help them make this world a better place for my retirement. So when I can find anything that helps to capture their imaginations, then I am going to put it into play in my classroom.

In my Summer Health course we watched a documentary on SuperBugs.  We used Padlet for class feedback, each table used iPads to post their discussion points on the Padlet Wall to create further discussion. 

Here are a few images from the class.  

SMART Board Padlet Wall Begins

Students Use iPads to post to wall from group discussion.

 
Students respond to Padlet Wall
Padlet Wall Grows


Don't tell anyone the students had FUN!!!


Wednesday, July 16, 2014

STUDENT SELF-ASSESSMENT

STUDENT SELF-ASSESSMENT

In a time of mindless escape I found myself watching an episode of "The Middle"  the other night and had deja vu moments as Mike Heck sat at the school athletic banquet and questions, "Does everyone get a trophy?"  And then he cringed as his daughter received her X-Country MVP trophy "Most Valuable in Punctuality".  


I have referred to this in the past as the "AYSO Syndrome". 
The idea that everyone plays, everyone wins and everyone gets a trophy.  The reality of dealing with defeat or realizing that you may not always be the best has diluted our ability to evaluate ourselves and assess our own abilities or lack thereof.  

As an educator and a former coach I still cringe, a la Mike Heck, at parents who proudly proclaim, "my child is an All Star".  When the real proclamation should come from the parents who can claim "my child was not an All Star".  Between,  area all-stars, regional all-stars, sectional all-stars and district all-star teams, it is a wonder that there are enough players in each league to fill the 
"All Stars".


Do we as educators spend enough time helping our students to authentically assess their talents, abilities and the work they produce?  

Fortunately, I came across a set of reflection questions on Edutopia to guide students through both introspection and reflection as a means to self-assess the work they produce in class. Primarily in the area of Project Based Learning (PBL).

The question set is organized in four categories: 

  • Backward-Looking  Where did they start?
  • Inward-Looking       What did they learn?
  • Outward-Looking    How do they compare?
  • Forward-Looking    Where can they go?


http://bit.ly/1sogh1m - Link to PDF from Edutopia

The 40 Reflection Questions

Backward-Looking:

1. How much did you know about the subject before we started?
2. What process did you go through to produce this piece?
3. Have you done a similar kind of work in the past (earlier in the year or in a previous grade; in school or out of school)?
4. In what ways have you gotten better at this kind of work?
5. In what ways do you think you need to improve?
6. What problems did you encounter while you were working on this piece? How did you solve them?
7. What resources did you use while working on this piece? Which ones were especially helpful? Which ones would you use again?
8. Does this work tell a story?

Inward-Looking:

9. How do you feel about this piece of work? What parts of it do you particularly like? Dislike? Why? What did/do you enjoy about this piece or work?
10. What was especially satisfying to you about either the process or the finished product?
11. What did/do you find frustrating about it?
12. What were your standards for this piece of work?
13. Did you meet your standards?
14. What were your goals for meeting this piece of work? Did your goals change as you worked on it? Did you meet your goals?
15. What does this piece reveal about you as a learner?
16. What did you learn about yourself as you worked on this piece?
17. Have you changed any ideas you used to have on this subject?
18. Find another piece of work that you did at the beginning of the year to compare and contrast with this what changes can you see?
19. How did those changes come about?
20. What does that tell you about yourself and how you learn?

Outward-Looking:

21. Did you do your work the way other people did theirs?
22. In what ways did you do it differently?
23. In what ways was your work or process similar?
24. If you were the teacher, what comments would you make about this piece?
25. What grade would you give it? Why?
26. What the one thing you particularly want people to notice when they look at your work?
27. What do your classmates particularly notice about your piece when they look at it?
28. In what ways did your work meet the standards for this assignment?
29. In what ways did it not meet those standards?
30. If someone else were looking at the piece, what might they learn about who you are?

Forward-Looking:

31. One thing I would like to improve upon is ...
32. What would you change if you had a chance to do this piece over again?
33. What will you change in the next revision of this piece?
34. What's the one thing that you have seen in your classmates' work or process that you would like to try in your next piece?
35. As you look at this piece, what's one thing that you would like to try to improve upon?
36. What's one goal you would like to set for yourself for next time?
37. What would you like to spend more time on in school?
38. What might you want next year's teacher to know about you (what things you're good at)?
39. What things you might want more help with?

40. What work would you show her to help her understand those things?


Thursday, July 10, 2014

THE VALUE OF INFORMATION - INFOGRAPHICS IN THE CLASSROOM

THE VALUE OF INFORMATION - INFOGRAPHICS IN THE CLASSROOM

In today's world of mass media and technology, students are exposed to more information in a week than an adolescent would see in a lifetime in Shakespeare's time. 

The ability to absorb, interpret, filter, store, categorize, evaluate and share this information seems to be an overwhelming task but the digital natives of this generation seem to be well adjusted to the glut of information broadcasted to their world. 

One mean of collating information that has become quite prevalent in today's world digital communication is the "infographic". 
 

The definition from Wikipedia states,  Information graphics or infographics are graphic visual representations of information, data or knowledge intended to present complex information quickly and clearly. 

This summer in my sophomore Health course we have used info graphics in a variety of ways.  

First the students viewed the documentary "Escape Fire" to gain perspective on the Health and Wellness Care System in United States. Utilizing infographics provided on the movie website (http://escapefiremovie.com/first-aid-kit) students evaluated and correlated information from the documentary.   

Next students used infographics to gather and analyze information concerning prescription and OTC drugs.  I provided them with variety of infographics about various topics concerning the pharmaceutical industry and health care. Students worked in groups to break down and evaluate the information on the infographics and then present the most valuable information to the class. 


Students also evaluated the effectiveness of the infographic as a means of conveying information.  Students analyzed and presented the  organization, presentation, color schemes, chart and data choice for each infographic.       


Finally students worked in groups to create their own infographics concerning one of the six issues raised in the documentary regarding our health care industry. Each infographic had to contain 8 to 12 data based sets of information presented in chart form with accompanying text. 
Students posted and shared their infographics online.  


For me this project provided the perfect means to incorporate the Six C's of Education.  Students add to Think Critically to analyze and evaluate data, gather information and format the infographic. Students worked in Collaborative Teams in student to student and online collaboration. Students Communicated in a variety of means throughout the project whether working in groups or presenting online or in the classroom. The design and production of the infographic provided an avenue to develop their Creativity. Analyzing data and looking at the effects on society of our health and wellness infrastructure forced students to evaluate the Culture they are living in. Lastly, students Utilized smartphones, iPads, and computers to Connect the dots and produce their infographics.